Peter is an operations manager in an organization. He wants to get consolidated views for the week or month into top incidents and problems pertaining to applications. He also wants to understand the most recurring incidents and problems reported by users, so that he can analyze if there is a more general issue with end users performance and transactions as seen with application performance metrics that if caught earlier, can reduce user incidents.
Based on the analyses, Peter can proactively eliminate the future problems and incidents by early action and communication.
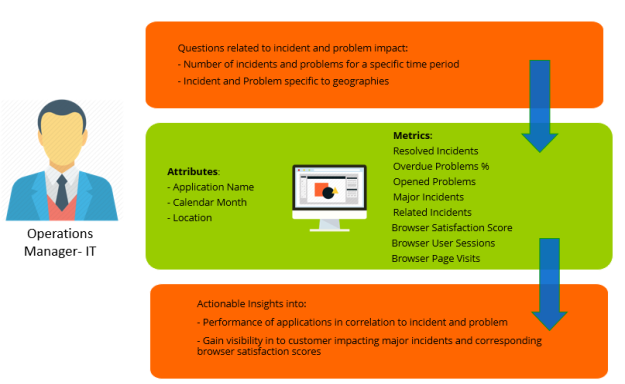
Peter wants to streamline the process by understanding the following and take effective steps to avoid future problems and incidents:
To analyze incidents and problems in applications as cross correlated with end user performance with respect to location, perform the following procedures:
Prerequisites: Ensure that you have logged in using appropriate credentials.
In this example, a bar chart is used. For more information on dossiers, refer Dossiers
From the top navigation panel, click  and select Existing Datasets.
In this example, Problem, Incident, Summary, and Mobile Application Summary iCubes are selected. The selected datasets are added to the DASHBOARD DATASET panel.
For more information on Monitor attributes and metrics, refer the Digital.ai Intelligence Applications User Documentation.
Using the report, Peter can get the following visibility in to the performance of applications and business services in relationship to the incident and problems reported:
© 2022 Digital.ai Inc. All rights reserved.